

How it runs: Triggered. An automation runs when a Datadog monitor fires, and you can also ask Hops directly.
What it does
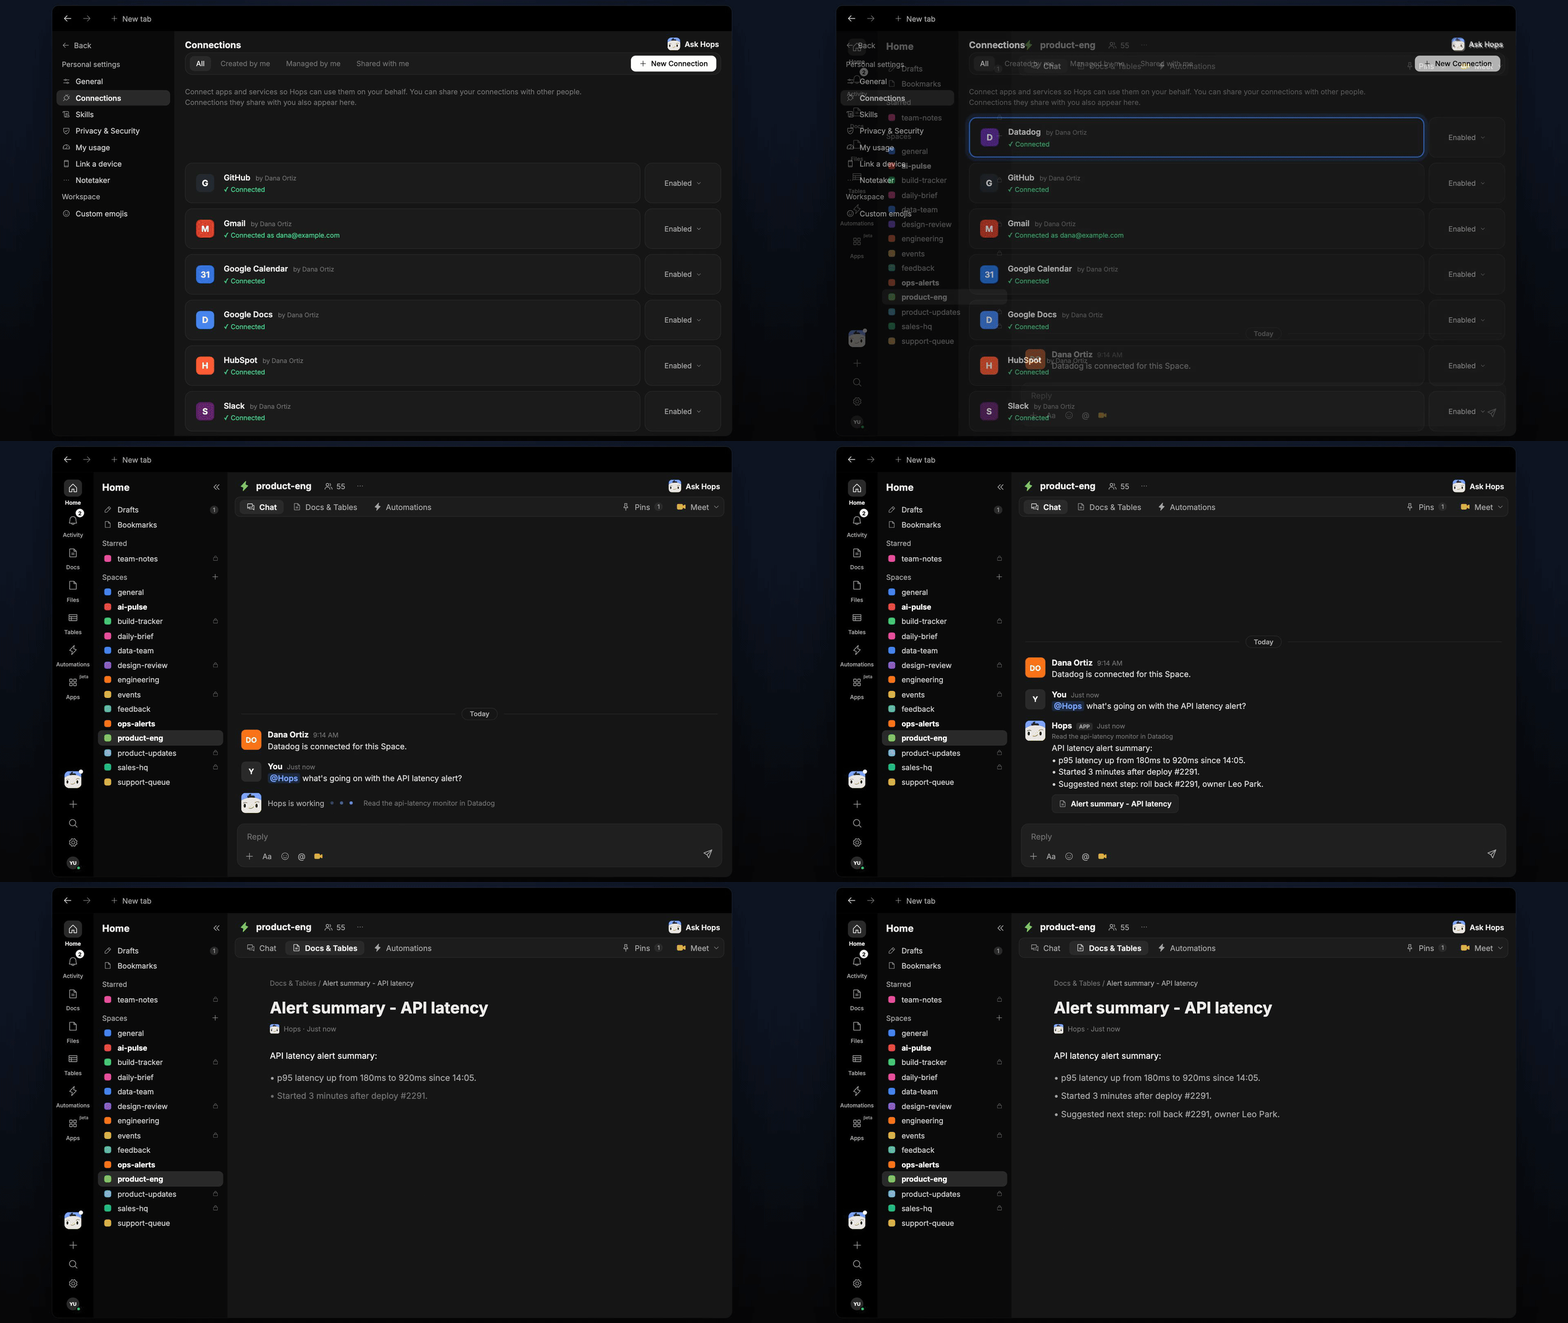
- Reads the alert in context. Hops pulls the monitor from Datadog, recent deploys from GitHub and related errors from Sentry.
- Says what changed and when. The summary lines up the alert start time with the deploys and error spikes around it.
- Names a likely cause. Hops gives its best guess and marks what is confirmed and what is not.
- Suggests one next step with an owner. For example, roll back the 14:05 deploy, owner the payments on-call.
- Never takes action itself. Hops only summarizes and recommends. People decide and act.
Ask Hops
Copy a prompt into any chat with Hops, or mention@Hops in a Space.
api-latency fired at 14:12, p95 at 2.4s (normal 400ms).
- Deploy payments-api #1872 went out at 14:05.
- Sentry shows a new timeout error on the orders query since 14:06.
- Likely cause: the new query in #1872 (not confirmed).
- Next step: roll back #1872. Owner: payments on-call.
What you get
- A post within minutes of the alert. The summary appears in the on-call Space.
- A saved Doc for the incident. The alert, timeline and next step are saved as a Doc in Docs, which postmortems can reuse.
- Answers on demand. Ask Hops follow-up questions in the same thread while you work the incident.
Connections needed
Connect these apps. Each card opens Connections in the app.Datadog
Monitors and alert history.
GitHub
Recent deploys and pull requests.
Sentry
Errors around the alert.
Slack
The on-call Space and incident threads.
Set it up
1
Connect your apps
Connect Datadog, GitHub, Sentry and Slack in Connections.See Connections.
2
Create the Space
Create a product-eng Space for on-call and pin the runbook index in Space context.See Spaces and Space context.
3
Add the skill
4
Trigger it
Create an automation that runs when a Datadog monitor fires. It posts the summary to the on-call Space and saves the record as a Doc in Docs.See Automation.