

How it runs: Scheduled. An automation runs every Monday at 9am, posts anomalies to the Finance Space and saves the comparison as a Table. You can also ask Hops any time.
What it does
- Compares spend to plan every week. Hops reads actuals from your accounting tool and the plan from Google Sheets or Excel.
- Flags 10% variances either way. Categories more than 10% over or under plan are called out.
- Shows the numbers. Each anomaly lists the department, the plan, the actuals and the variance.
- Works from uploads too. Drop a spend export such as a weekly CSV into the Space and Hops reads it.
- Stays quiet when nothing is off. If every category is within range, the post says so in one line.
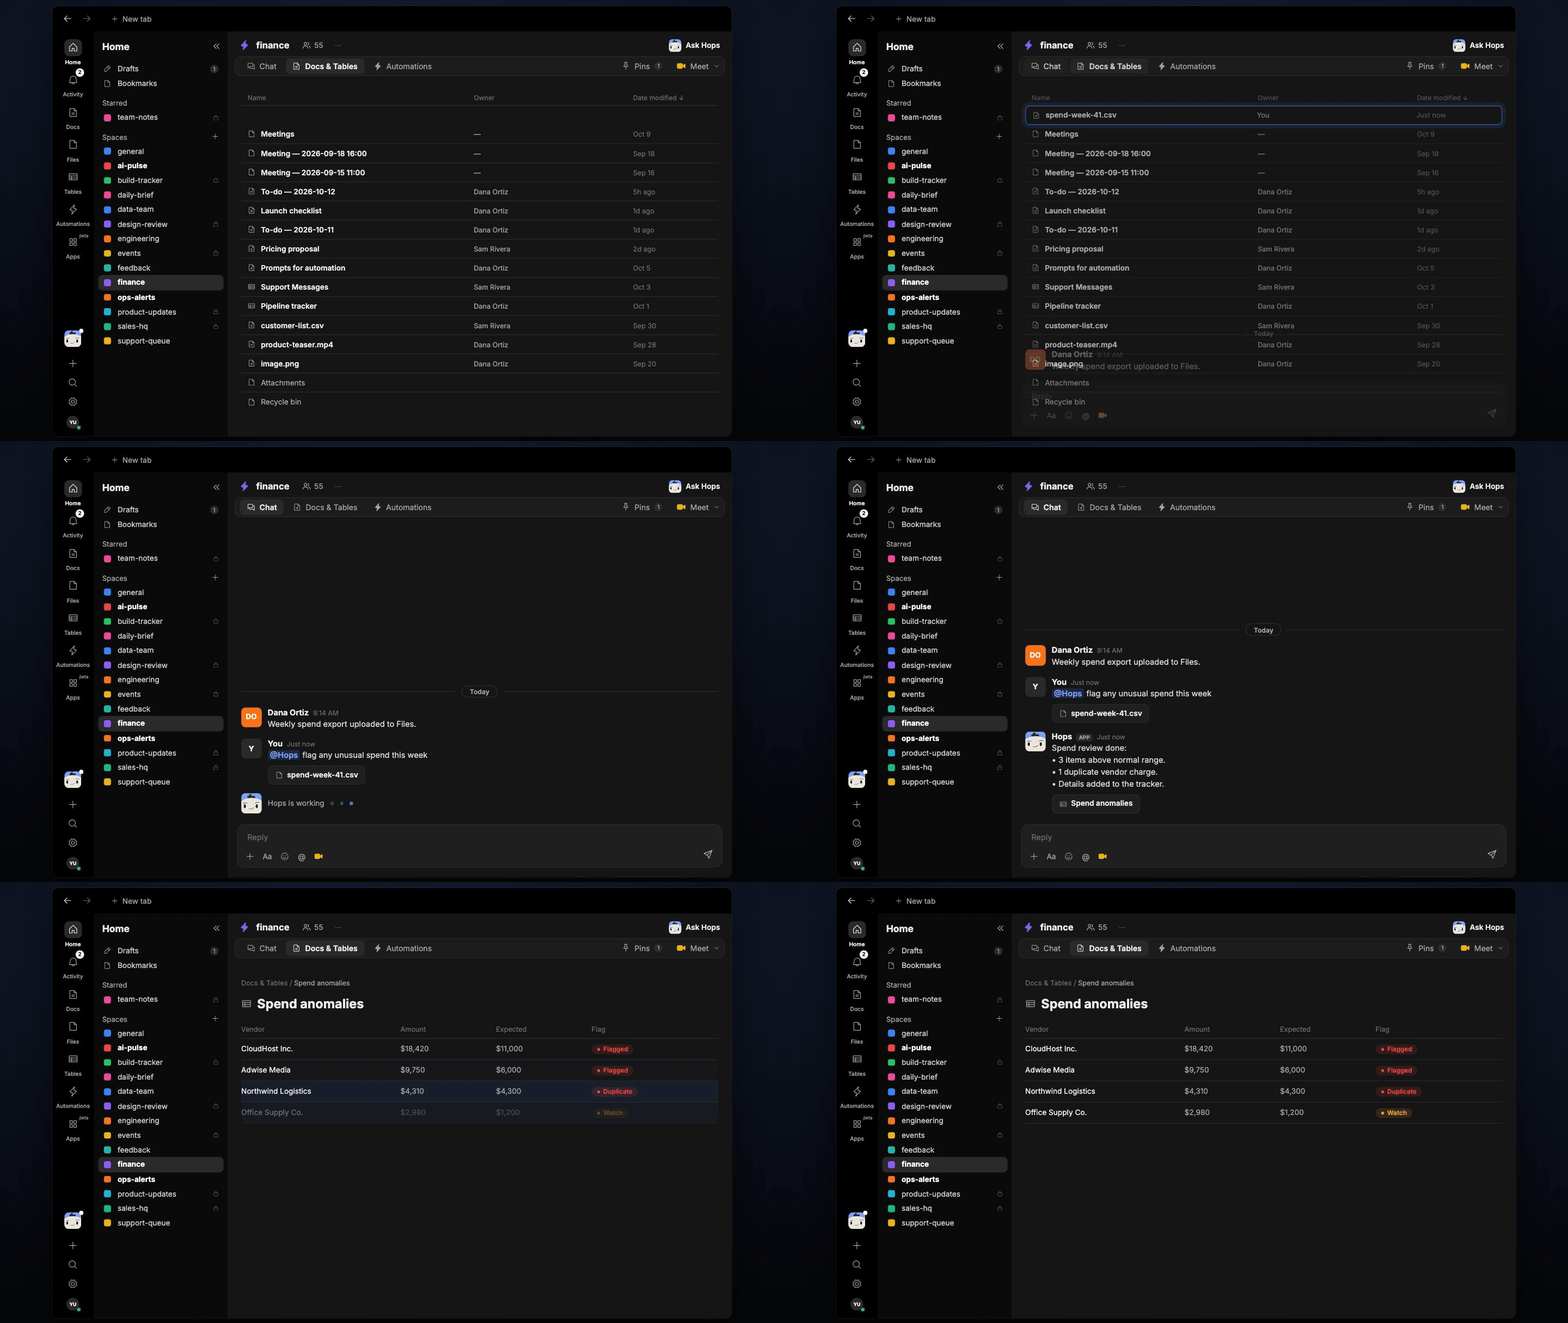
Ask Hops
Copy a prompt into any chat with Hops, or mention@Hops in a Space.
Week 41 spend anomalies:
- Marketing: plan 59K, +23%.
- Cloud hosting: plan 26K, -13%.
- All other categories are within 10% of plan.
What you get
- An answer in chat, in the same thread, whenever you ask.
- A weekly post in the Finance Space listing each anomaly with department, plan, actuals and variance.
- A spend vs plan Table in Tables of the Space, updated each week.
Connections needed
Connect these apps. Each card opens Connections in the app.QuickBooks
Actual spend (or Xero or your accounting tool).
Google Sheets
The plan to compare against (or Excel).
Slack
Posts anomalies to the Finance channel.
Set it up
1
Create the Space
Create one Finance Space. Add the current plan to Space context.See Spaces and Space context.
2
Connect your apps
Connect the apps above in Connections.See Connections.
3
Add the skill
4
Schedule it
Every Monday at 9am Hops posts anomalies to the Finance Space and updates the spend vs plan Table.See Automation.