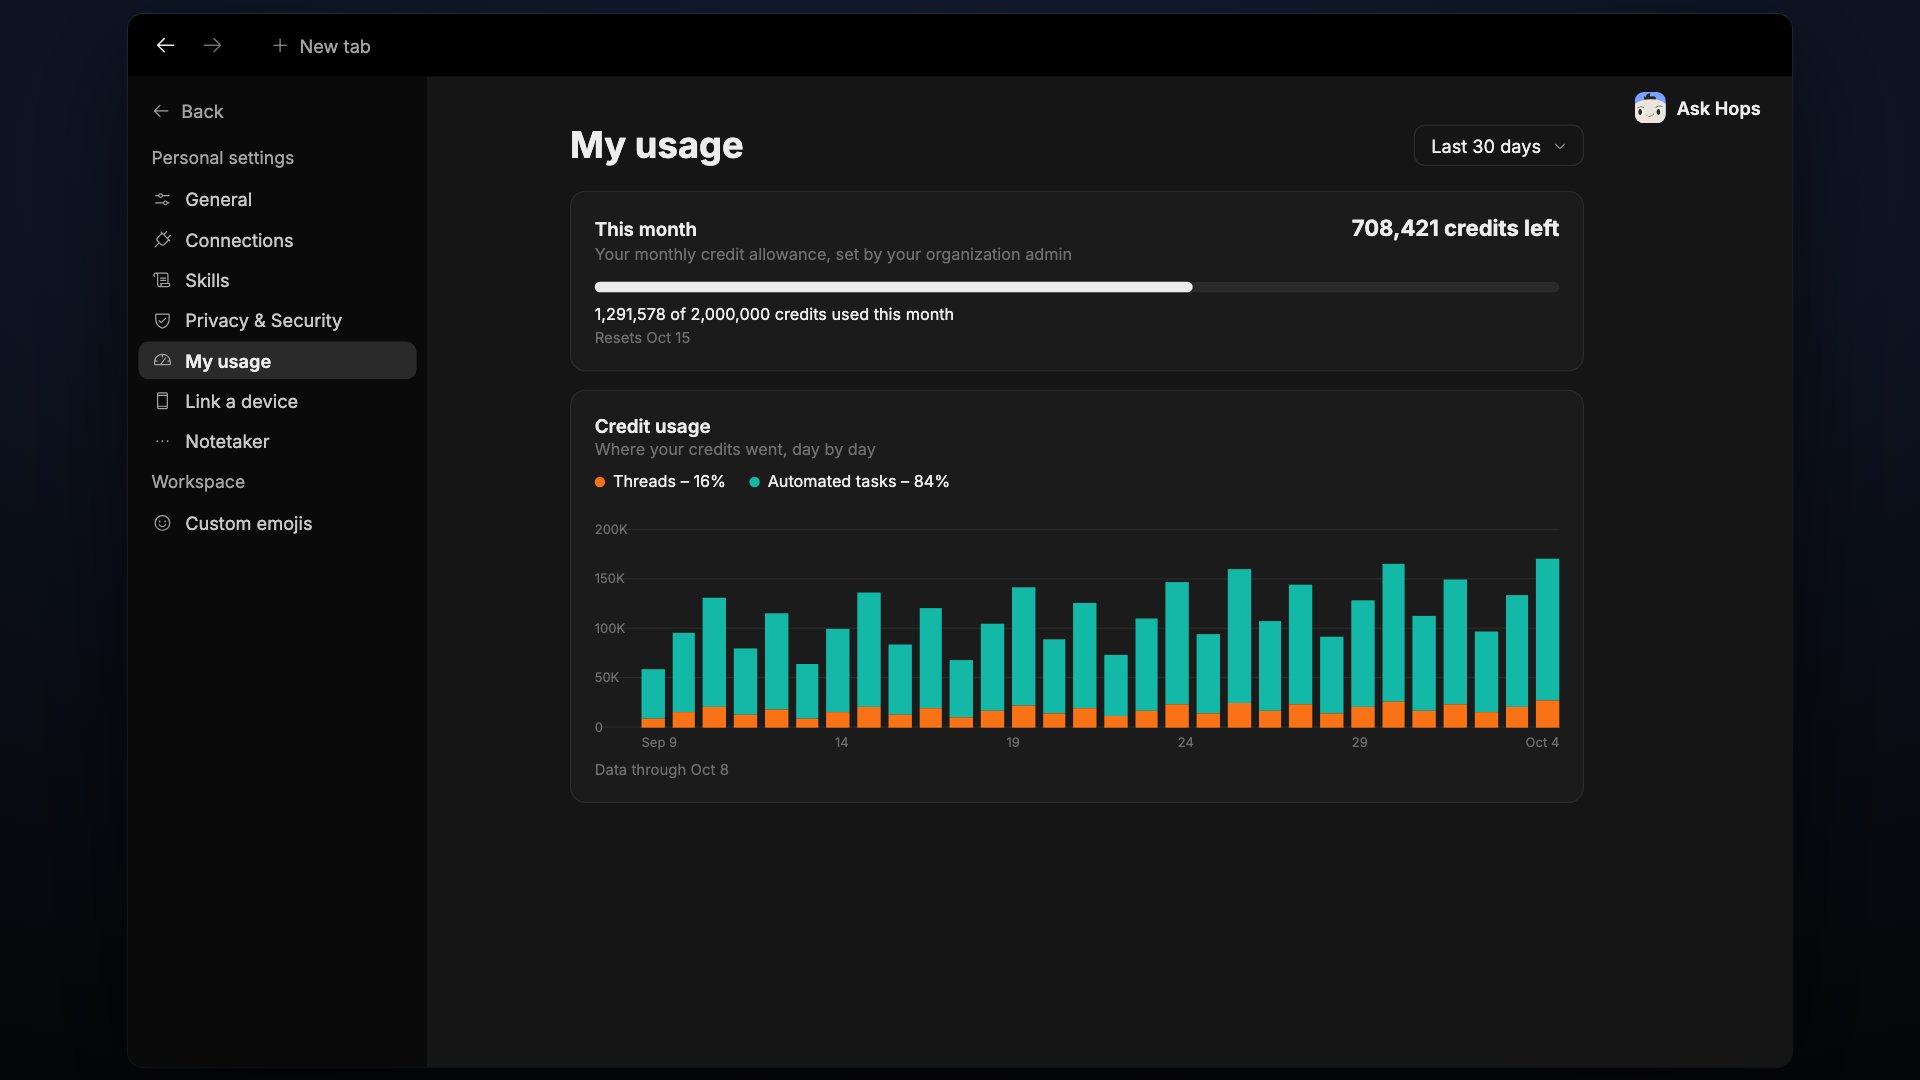
My usage shows your own credit spend. Open Settings, then My usage. Use the period dropdown at the top right (default Last 30 days) to change the range.
The My usage page showing this month and a credit usage chart.

This month

Your monthly credit allowance, set by your organization admin. The card shows how many credits you have left, a progress bar, and a line such as X of 2,000,000 credits used this month. It also shows when the allowance resets. This follows your billing month, not the period selected at the top, and is read live from billing, so it doesn’t lag like the sections below.

Credit usage

A daily stacked bar chart of where your credits went:
  • Threads — conversations with Hops.
  • Automated tasks — runs of automations.
The footer shows the date the data runs through. An accessible table with the same numbers is available under the chart (Day, Threads credits, Automated tasks credits, Total credits).

Your automations

Runs of automations you own count toward your spend, whoever triggers them. The table shows: The last row, Other, covers deleted automations and background spend.

Recommendations

Suggestions computed from your own numbers. Each names what it’s based on, for example an automation whose runs keep failing. Failed runs still spend credits, so reviewing or pausing the automation stops the waste. Use Review automation to jump to it. Click Ask Hops at the bottom to have Hops open this page’s numbers as an editable draft.