> ## Documentation Index
> Fetch the complete documentation index at: https://hopsdocs.mintlify.site/llms.txt
> Use this file to discover all available pages before exploring further.
# Engineering dashboard
> Cycle time, deploys and open bugs in one weekly table.
Engineering health lives in GitHub, Linear and Sentry, and nobody has time to pull it together. Hops refreshes one table every week so the team sees the trend without opening three tools.
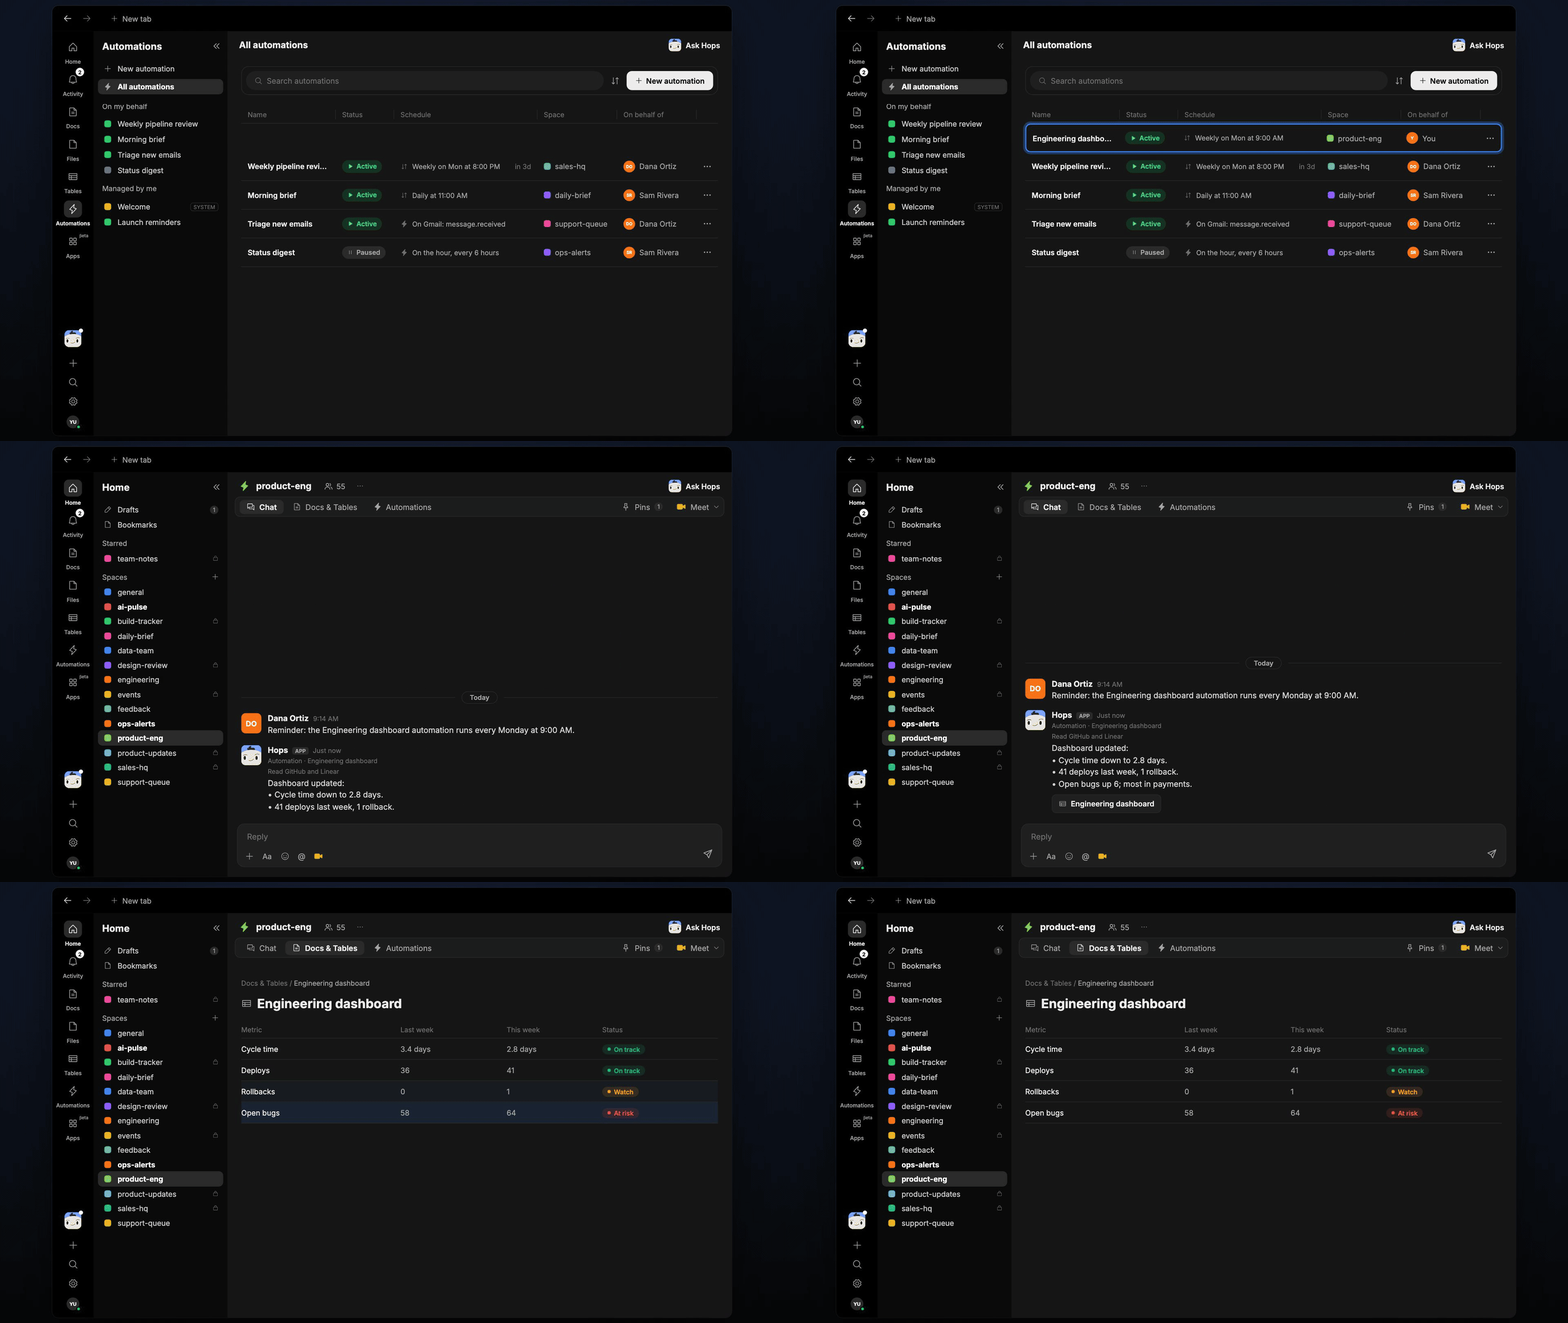
**How it runs:** Scheduled. An automation runs every Monday at 9am, posts the week's headline and updates a Table. You can also ask Hops any time.
## What it does
* **Pulls the numbers from the source.** Cycle time and deploys from GitHub, open bugs from Linear or Jira, and error trends from Sentry.
* **Covers the last 7 days.** Cycle time, deploys, rollbacks and open bugs.
* **Compares with the prior week.** Each metric gets a status based on the change.
* **Calls out the biggest change.** One line on what moved most and why it matters.
* **Keeps history.** Each week adds a row, so the Table becomes a trend line.
 ## Ask Hops
Copy a prompt into any chat with Hops, or mention `@Hops` in a Space.
```text theme={null}
Update the engineering dashboard for this week.
```
```text theme={null}
What was our median cycle time last week for the Acme web team, and how does it compare with the week before?
```
```text theme={null}
How many deploys and rollbacks did we have in the last 7 days?
```
```text theme={null}
Which bug count changed most this week, and what drove it?
```
```text theme={null}
Show me the last 8 weeks of cycle time as a table.
```
Example reply:
> Engineering dashboard, week of Oct 13:
>
> * Cycle time: 2.1 days (up from 1.8). Status: watch.
> * Deploys: 31, rollbacks: 1.
> * Open bugs: 47 (down 6).
> * Biggest change: cycle time rose because 5 PRs waited over 2 days for review.
## What you get
* **A weekly post.** The headline and biggest change land in the Space chat on Monday morning.
* **An updated Table.** A new row is added each week in **Tables** in the Space, so the history stays in one place.
* **Answers on demand.** Ask Hops about any metric in chat between refreshes.
## Connections needed
Connect these apps. Each card opens Connections in the app.
Pull requests and deploys.
Open bugs and issues (or Jira).
Open bugs and issues (or Linear).
Error volume and trends.
## Set it up
Connect GitHub, Linear or Jira, and Sentry in **Connections**.
See [Connections](/docs/connections/overview).
Create a **product-eng** Space for engineering metrics. Pin the metric definitions in Space context so numbers stay consistent.
See [Spaces](/docs/spaces/overview) and [Space context](/docs/spaces/space-context).
Create an automation that runs every Monday at 9am. It refreshes the dashboard Table in **Tables**, compares with the prior week and posts the headline to the Space.
See [Automation](/docs/spaces/automation).
## Related topics
- [Product & Engineering](/teams/product-engineering.md)
- [Client status and dashboard](/teams/professional-services/use-cases/client-status-report.md)
- [Feedback mining](/teams/product-engineering/use-cases/feedback-mining.md)
- [Live revenue dashboard](/teams/founders-executives/use-cases/live-dashboards.md)
- [Agencies & consulting](/teams/professional-services.md)
This documentation is built and hosted on [Mintlify](https://mintlify.com), a developer documentation platform.
## Ask Hops
Copy a prompt into any chat with Hops, or mention `@Hops` in a Space.
```text theme={null}
Update the engineering dashboard for this week.
```
```text theme={null}
What was our median cycle time last week for the Acme web team, and how does it compare with the week before?
```
```text theme={null}
How many deploys and rollbacks did we have in the last 7 days?
```
```text theme={null}
Which bug count changed most this week, and what drove it?
```
```text theme={null}
Show me the last 8 weeks of cycle time as a table.
```
Example reply:
> Engineering dashboard, week of Oct 13:
>
> * Cycle time: 2.1 days (up from 1.8). Status: watch.
> * Deploys: 31, rollbacks: 1.
> * Open bugs: 47 (down 6).
> * Biggest change: cycle time rose because 5 PRs waited over 2 days for review.
## What you get
* **A weekly post.** The headline and biggest change land in the Space chat on Monday morning.
* **An updated Table.** A new row is added each week in **Tables** in the Space, so the history stays in one place.
* **Answers on demand.** Ask Hops about any metric in chat between refreshes.
## Connections needed
Connect these apps. Each card opens Connections in the app.
Pull requests and deploys.
Open bugs and issues (or Jira).
Open bugs and issues (or Linear).
Error volume and trends.
## Set it up
Connect GitHub, Linear or Jira, and Sentry in **Connections**.
See [Connections](/docs/connections/overview).
Create a **product-eng** Space for engineering metrics. Pin the metric definitions in Space context so numbers stay consistent.
See [Spaces](/docs/spaces/overview) and [Space context](/docs/spaces/space-context).
Create an automation that runs every Monday at 9am. It refreshes the dashboard Table in **Tables**, compares with the prior week and posts the headline to the Space.
See [Automation](/docs/spaces/automation).
## Related topics
- [Product & Engineering](/teams/product-engineering.md)
- [Client status and dashboard](/teams/professional-services/use-cases/client-status-report.md)
- [Feedback mining](/teams/product-engineering/use-cases/feedback-mining.md)
- [Live revenue dashboard](/teams/founders-executives/use-cases/live-dashboards.md)
- [Agencies & consulting](/teams/professional-services.md)
This documentation is built and hosted on [Mintlify](https://mintlify.com), a developer documentation platform.